Getting Started Guide
Table of contents
Getting started with JasperReports in Servoy can be obtained in 5 easy steps.
Get the plug-in
Install the plug-in
Get the report designer
Build the report
Run the Report
Get the Plug-in
The first step in using JasperReports with Servoy is to get the plug-in. The plug-in is available at https://github.com/Servoy/servoy_jasperreports as an open source project. There are three different options for the plug-in:
Basic
ChartNScript
Advanced
The reason for using multiple versions of the program is to control the size of the supporting libraries required for different features of Jasper Reports. For example, if you do not use vector graphics in your reports, you really should not load all the libraries required for vector graphics support as this will waste space on your clients’ machines.
Choosing the Correct Version
Basic – This version includes the very basic versions of the plug-in. The libraries included are the very basic required to run a report in JasperReports.
IMPORTANT If you are using Groovy as your expression language in the report, this version of the plug-in will not work. You must set your report language to Java (a property of the report set in iReport) to run reports with this plug-in. Also note that Groovy is the default language any new report in iReport is set to.
ChartNScript – This version includes libraries for Groovy support as well as the libraries needed for building charts in JasperReports. It is the version used by most people.
Advanced – This version allows for the most flexibility of the plug-in as you must specify and build it yourself. This requires installing JasperReports (not iReport) and ANT. Using ANT, you will build your own version, pulling the libraries needed from your JasperReports installation. This version is required if you want to use some of the more specialized features of JasperReports, such as barcodes and vector graphics.
NOTE The advanced version also allows you to choose the version of JasperReports you want to use and also adjust any supporting libraries as necessary.
Installing the Plug-in
To install the Basic or ChartNScript versions:
Download the desired plug-in (should be a compressed file).
Uncompress the file.
If Servoy Developer is running, shut down Developer.
Move the three items from the folder (servoy_jasperreports.jar, servoy_jasperreports.jar.jnlp, and the servoy_jasperreports folder) into the application_server/plugins folder.
Restart Developer.
NOTE ome versions of the plug-in only include the .jar file. For a new install, install the full plug-in first, then overwrite the new version’s jar file with the one provided with the release.
To install the Advanced version:
Download the Advanced plug-in file.
Install JasperReports
Install ANT
Follow instructions included in the readme file for the plug-in.
Getting the Report Designer
Report templates are basically xml files. The report template provides a specification to JasperReports during runtime for formatting, design, data specifics, etc. We only need a text editor to create a report template, but this would be tedious and time consuming. JasperSoft provides us with a report design program for create, editing, and troubleshoot report templates. This program is call iReport.
iReport is available from JasperSoft, and as JasperReports, there are community editions available (via JasperForge). To download iReport, you can go the following website: http://jasperforge.org/projects/ireport.
NOTE It is relatively important to use the same versions of JasperReports and iReport. Sometimes there are subtle differences between versions that can cause things to break when running reports. If you are using the Basic or ChartNScript versions of the plug-in, they are already built on a specific version of JasperReports. Be sure to read the release notes for the plug-in to ensure you download the correct version of iReport (at the time of this document, the version used is 3.7.1). To get previous releases of iReport, they are located at different location on the SourceForge website: http://sourceforge.net/projects/ireport/files/.
Once you have downloaded the installer/dmg/zip folders, follow the instructions provided by JasperSoft to install iReport. Some key features/information about iReport and JasperReports:
Reports built in JasperReports/iReport are banded reports, meaning that the layout of the report’s sections is in horizontal bands. Examples of bands include title, page header, page footer, detail, summary, etc. Each band prints on the report depending on its role, i.e. a page header prints at the top of each page.
iReport has a rich graphical user interface based in NetBeans. Many of the items you place on a report are dragged from the report inspector or from an element palette. Many objects are affected by right click menus as well.
Although programming is not required, for specific actions it can be useful to use code. JasperReports and iReport support using Java, Groovy, and JavaScript as an expression language. iReport offers a handy expression builder with syntax color coding to build expressions.
Build the Report
Using iReport, we can start building a report to run from Servoy. Some considerations to consider before we start building our report:
What data are we going to use to build a report? Which tables are involved?
Will there be any “disconnected” data? Will there pieces of the report that are not relationally joined? (In other words, will there be a need for a subreport?)
What is our delivery method? Will this be delivered through smart client, web client, or both? Are we just launching these reports from Servoy, or will they also be used with Jasper Server?
Data filling options: do we want to use a direct database connect or do we want to use a FoundSet or DataSet passed to the report? Note that this answer may be determined by the answers to the questions above.
Data Filling Options:
Direct database connection (traditional) – in this method, the connection information is passed to JasperReports and the report engine will run a SQL query directly to the database.
Some of the pros for this method include:
More versatile: The report can be used with Jasper Server, as it will require a database connection as well.
Easier to test/debug: The database connection can be independent from Servoy during testing, so you can actually run reports in iReport and see the report as if it were ran from Servoy.
Some of the cons for direct database connections:
SQL query is required: You must write a SQL query to specify the data for the report. In certain cases, these queries can be complex. You also cannot write queries across database servers.
Complexity in data selection: You may need to create parameters that are used in the WHERE clause to narrow the data efficiently.
Calculated values: Any values you have derived in Servoy (calculations, aggregations, etc.) have to be rewritten in the report. Only values stored in the database are available to the report in this option.
Server-side processing: All processing is server side with this option, cannot take advantage of the smart client’s processor for report generation. NOTE: In certain cases, this is actually can be a good thing.
Passing a FoundSet – in version 3.x and later of the PLUG-IN, you can also choose to pass a Servoy FoundSet object to the report. This option allows you to create the foundset of records you want to use for the report in Servoy, and then pass it to the report.
Some of the pros for this method include:
No SQL required: Instead of using a query, you can use highly efficient Servoy foundsets (including relations) to specify data selection. Related data across database servers can be used in a single report.
Data selection made easy: Since a foundset is passed, it is easy to use Servoy functions or even end user selection to narrow the foundset and select the data desired for the report.
Calculated values: Any calculated values are passed to the report as they are part of the foundset.
Client side processing: Any foundset based reports ran from a smart client are ran client side, utilizing client resources. NOTE: In certain circumstances this can be a hindrance in reporting.
Some of the cons for this method include:
Less versatile: Foundset reports use a Servoy foundset, so they must be ran from Servoy so that the data is filled correctly.
Less debugging/testing options: Since a foundset report is not independent, you cannot test the report in iReport. You can compile the report to ensure object placement and types match, but you cannot fill data. NOTE: If you set up your environment properly, it is not hard to use Servoy to test reports during development.
Using subreports in smart client: Reports that run client side can be problematic if they contain subreports. This has to do with the location reference to the subreport. The main report must know where to get the subreport during runtime. Since the reports reside on the server, it cannot readily resolve the location the client. Some workarounds to the issue include:
Placing the subreports in a directory that can be resolved by every client, then hardcoding the directory in the report (or passing the location information through a parameter).
Moving the subreport to the client before running the report (various methods of doing this in Servoy).
Passing a DataSet – in the latest version, you can also choose to pass a Servoy DataSet object to the report. This option is similar to the foundset option, the DataSet is filled from javascript code (for example using databasemanager.getDataSetByQuery) and the report runs locally with the client in case of the smart client.
Setting up iReport (Direct Database Connection only)
Before actually starting the report design process in iReport, we need to setup iReport to read our database. This will allow us to use iReport’s data tools in building the query, and also allows us to test the report as we are building it.
To setup iReport for database connectivity:
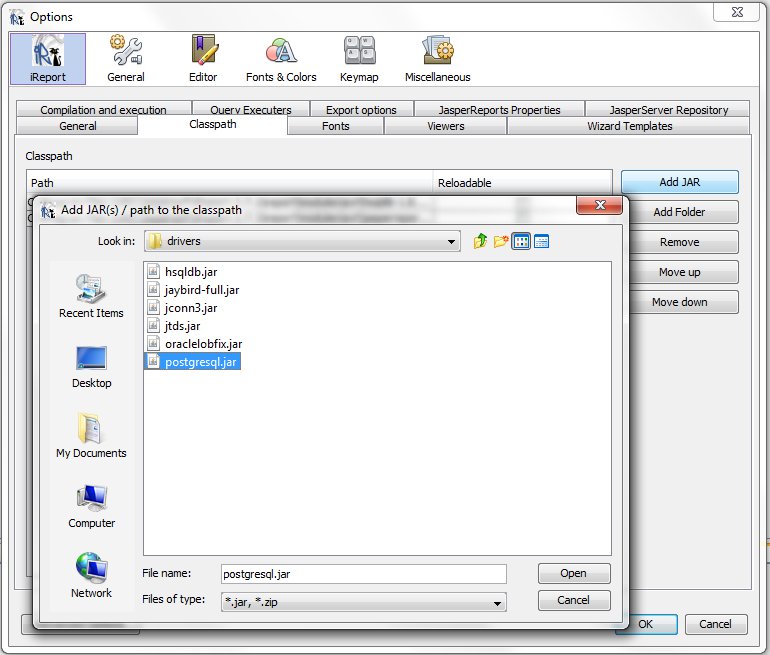
Set up the driver classpath.
Open iReport
In the menubar, select Tools –Options
In the window, make sure iReport is selected, then select the Classpath tab.
Click the Add JAR button.
Select the path to the driver. In most cases, you are using the driver in Servoy as well, so it is good practice to just select the same driver you are using in Servoy. You will find your Servoy drivers in the application_server/drivers folder.

After selecting the jar file, select the Open button.
Your driver should appear in the list. Select OK to close the options window.
Set up the database connection (datasource).
Open iReport.
On the Designer toolbar, select the Report Datasources button

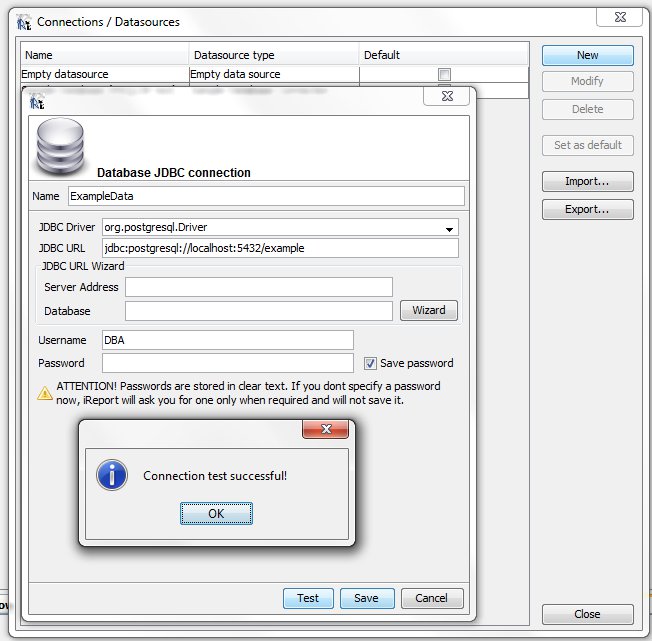
In the Connections/Datasources window, select New.
In the Datasource wizard, select Database JDBC connection and select the Next button
Enter the connection information for your database connection. A good place to find this information is in your Servoy Developer’s Database Server node; open the connection information for the database you want to use, and then copy the driver and url from Developer to this screen. It is also a good idea to check the save password box or iReport will prompt you every time it wants to make a connection for a password. Be sure to give the connection a name.
Click the test button. You should see a success message.

If the test was successful, click Save, then Close.
Creating a New Report
To create a new report in iReport:
Open iReport
From the menu bar, select File – New…
From the New file window, select the template for the desired report.
Select either “Open this Template” or “Launch Report Wizard” and enter name of the report and save location, then follow the steps of the wizard.
NOTE “Launch Report Wizard” is more suitable for Direct Database Connection reports as it will walk you through the query and field selection processes. This is useless for Foundset /DataSet Based reports.
Build the Report – Data Selection
We are now ready to actually start building our report. We start by deciding on and selecting our data for the report. In JasperReports, there are three types of objects we can use for data in our report:
Fields
Parameters
Variables
For the time being, we will focus only on fields.
When we consider what fields we want to use for a report, we need to think about the tables and relationships between data points. We need to think about the base record for the report will be and make sure to get all the fields we need in relation to that record.
Example: Considering the example_data database that comes with Servoy, let’s say you want to build an orders report that includes all the details for each order. In this case, your base table would be the order details table, and then through relations you would include the orders and customers tables. In the report, you would use grouping to get the desired effect of showing orders per customer.
Setting up Fields for a Foundset/DataSet Based Report
To create a field for use in a foundset/DataSet based report:
Open your report in iReport.
In the Report Inspector window, right click on Fields and select Add Field. A field will appear under the fields node.
With the field selected, in the properties window, change the name to match the name of the dataprovider of the foundset or column name of the DataSet being passed to the report.
In the properties window, set the Field Class property to match the data type of the field being passed. NOTE: these are Java classes.
In a foundset report, it may become necessary to refer to a related data point in addition to data points based on the base table. To do this, just add the Servoy relation name to the name of the field. You can also refer to fields across multiple relations.
Example: In a report based on order_details, it may be useful to place the order date and the company name in the report for an order. The field name for order date would be: order_details_to_orders.orderdate (assuming there is a relation named order_details_to_orders). The field name for company name would be: order_details_to_orders.orders_to_customers.companyname (again, assuming there is a relation named orders_to_customers as well). These field can be placed in the report and will be filled with the related data to the order detail record.
Field Selection in a Direct Database Connection Report.
The source of the fields for a direct database connection report come from the SQL query used to define the report. If you use the Launch Report Wizard, you defined this query while working through the wizard. If you did not use the wizard, you can open the query window and define the query.
To open the query window:
Open the report in iReport
In the report editor window, on the report toolbar, select Report Query button

The Report Query window appears, giving many different options to build the query and fields.

Some of the features of the Report Query window:
An editor window to type SELECT statements into and options to load or save these queries
A Query Designer that utilizes a GUI to build SELECT statements, including joins.
The ability to read fields from the SELECT statement, automatically (the Automatically Retrieve Fields checkbox) or manually (the Read Fields button). If you use an AS clause in your SELECT statement, it will use the alias instead for the field name.
The ability to set non SELECT options for filter expression and sort options (useful if you are doing a foundset based report).
Once you have set up the query and filled the fields, these fields will appear in the Report Inspector window.
Using Parameters for SQL Query Based Reports
In almost every case of a SQL query based report, you will need to have some way of specifying the WHERE clause, otherwise your report will return all the records in the database. You can certainly hard code the WHERE clause for specific values, but normally it is much more useful to use a parameter to specify criteria for the report. To use a parameter in the WHERE clause, you must:
Create a parameter.
Add the parameter to the SQL query.
To create a parameter:
Open the report in iReport
Right click on the Parameters node in the Report Inspector and select Add Parameter
With the new parameter selected, change the name in the properties window to adequately describe the parameter’s purpose.
To add the parameter to your SQL query:
Open the Report query window
In the query text, find the location where the parameter is needed. Most likely this is in the WHERE clause after indicating a column (
WHERE customerid = <parameter here>)Add the parameter name enclosed with
$P{}. Example:$P{mycustomerid}Save the query and close the window.
Build the Report – Designing the Layout
Now that we have fields for our report, we can design the layout for our report. The WYSIWYG interface of iReports makes designing reports easy. Below are some common activities in designing reports.
Adding a text field to a report:
NOTE Keep in mind that elements (text fields, static text, lines, etc.) that appear on the report are different objects than the actual fields, parameters, and variables that relate to data for the report. A text field is an element on the report that CAN REFER to a field, parameter, or variable for its value.
Open the report in iReport
Find the field you want to represent in the report inspector window.
Click and drag the field to the location you want it to appear in the report.
A text field is created referring to the field value you wanted to use. OR
Open the report in iReport.
Drag a text field from the Palette. NOTE: If the Palette window is not visible, you make select it by going to the menu bar and selecting Window – Palette.
Place the text field on the report.
With the text field highlighted, in the properties window, open the Text Field Expression editor. 9 Using the expression editor, set the value for text field to a field, parameter, variable, or result of a function. Close the editor.
In the properties window, verify the Expression Class matches the type of whatever the text field expression is returning.
Your text field is ready.
Adding static text (label) to a report:
Open the report in iReport.
Drag a static text element from the Palette. NOTE: If the Palette window is not visible, you make select it by going to the menu bar and selecting Window – Palette.
Place the element on the report.
With the field highlighted, in the properties window, edit the Text property.
Adding a group to a report:
Right click on the report name in the Report Inspector.
Select Add Report Group. This will start the Group wizard.
In the Group wizard, give the group a name, then either select a field to group on or write an expression to group on. Click next.
Select which bands you want to add to the report (header and/or footer). Select Finish
The select bands now appear in the report and the group has been added.
In certain cases, you may want to display a value based on the group. Example: if you are grouping by customers, the companyname field would be handy to display. To add a field to a group band:
Select the field from the Report Inspector and drag/drop it on the desired group band.
A window appears asking for a choice between two options. Select “The field value”
A text field based on the field is added to the group band.
In other cases, you may want to display an aggregate value for the entire group. Example: If you were grouping the report by orders, you may want to show the total number of items for the entire order. You can place the quantity field from the order_details table in the group band to aggregate and show the total items for the entire order. To add an aggregate value to the group band:
Select the field from the Report Inspector and drag/drop it on the desired group band.
A window appears asking for a choice between two options. Select “The result of an aggregation function” and select the aggregate type.
A text field based on a newly create variable is added to the group band. NOTE: The new variable is set to calculate the aggregate. You can adjust the variable’s settings in it properties.
Other elements can be added from the Palette window. Note that some elements may have special properties that can be set by right clicking on the element once it has been placed on the report.
Run the Report
Previewing with iReport
If you have built a SQL query report, you can run this report directly in iReport. To preview the report in iReport:
Save the report.
Click on the Preview button on the report designer toolbar.
The report will compile. Check for any errors in the console, if the report compiled without errors, it will start fill data.
If there are parameters required and they are set to prompt, a window will appear for each parameter asking for a value.
The report will appear in the designer window with any data filled.
Configuring the Plug-in
Ideally, we want to run these reports in Servoy. This will require writing some code to invoke the plug-in. Before using the plug-in, we must configure it for use. To properly configure the plug-in:
Start Servoy
Open a browser and navigate the Servoy Application Server Administration Page:
http://<your_server_or_localhost>:8080/servoy-admin. NOTE: For Developer, go to localhost.On the admin page, select Server Plugins from left side menu.
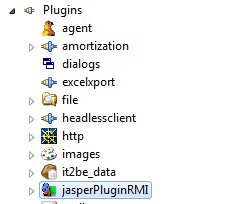
Under the jasperPluginRMI, enter the path to the folder that contains your reports

Select Save Settings.
Restart Application Server (or Developer)
Using the JasperReports Plug-In
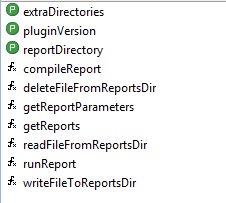
The runReport function has 6 parameters:
First Parameter
Can be either a server name (like “example_data”) a Foundset (foundset or
customers_to_orders) or a DataSet (result fromdatabasemanager.getDataSetByQuery())When using a server name, the report must have a SQL query to run in order to get the data.
Second Parameter
Name of report (“rptName.jrxml” OR “rptName.jasper”)
If a jrxml file is supplied, it will run the .jasper file first; if the .jasper file does not exist, it will try to compile the report into memory.
Third Parameter
Can be one of four things
Output file name and path
Boolean value for print dialog to appear
Printer name to print the file
Map like {FILENAME : "myfilename", DOWNLOAD : true} to trigger download of the report with the specified filename from the web client
If null and output option is set to “print”, the report will print to the default printer without dialog.
If it is a file name and path, and the method is called from a web client, the file is saved server side and the path should be valid on the server.
Fourth Parameter
Output options
Some popular options
view – Launches the Jasper Report Viewer
print – Prints the report to a printer
rtf – Prints report to an rich text format file
Others that print to a file
txt
cvs
xls
html
xml
Fifth Parameter
Report Parameters
Parameters must be passed as an object.
var params = new Object();
params.parameter1 = “First Parameter”;
params.parameter2 = 2;
OR
var params = {parameter1:”First Parameter”, parameter2:2};
Sixth Parameter
Locale String
This is an i18n string, example “en” for English.
If non is specified, it will use the current client’s language
Statement Return
runReport returns a value of type byte array
The report return can be saved in a media field, allowing the user to save the report in a database.
Last updated

