# Log Activity

## Overview

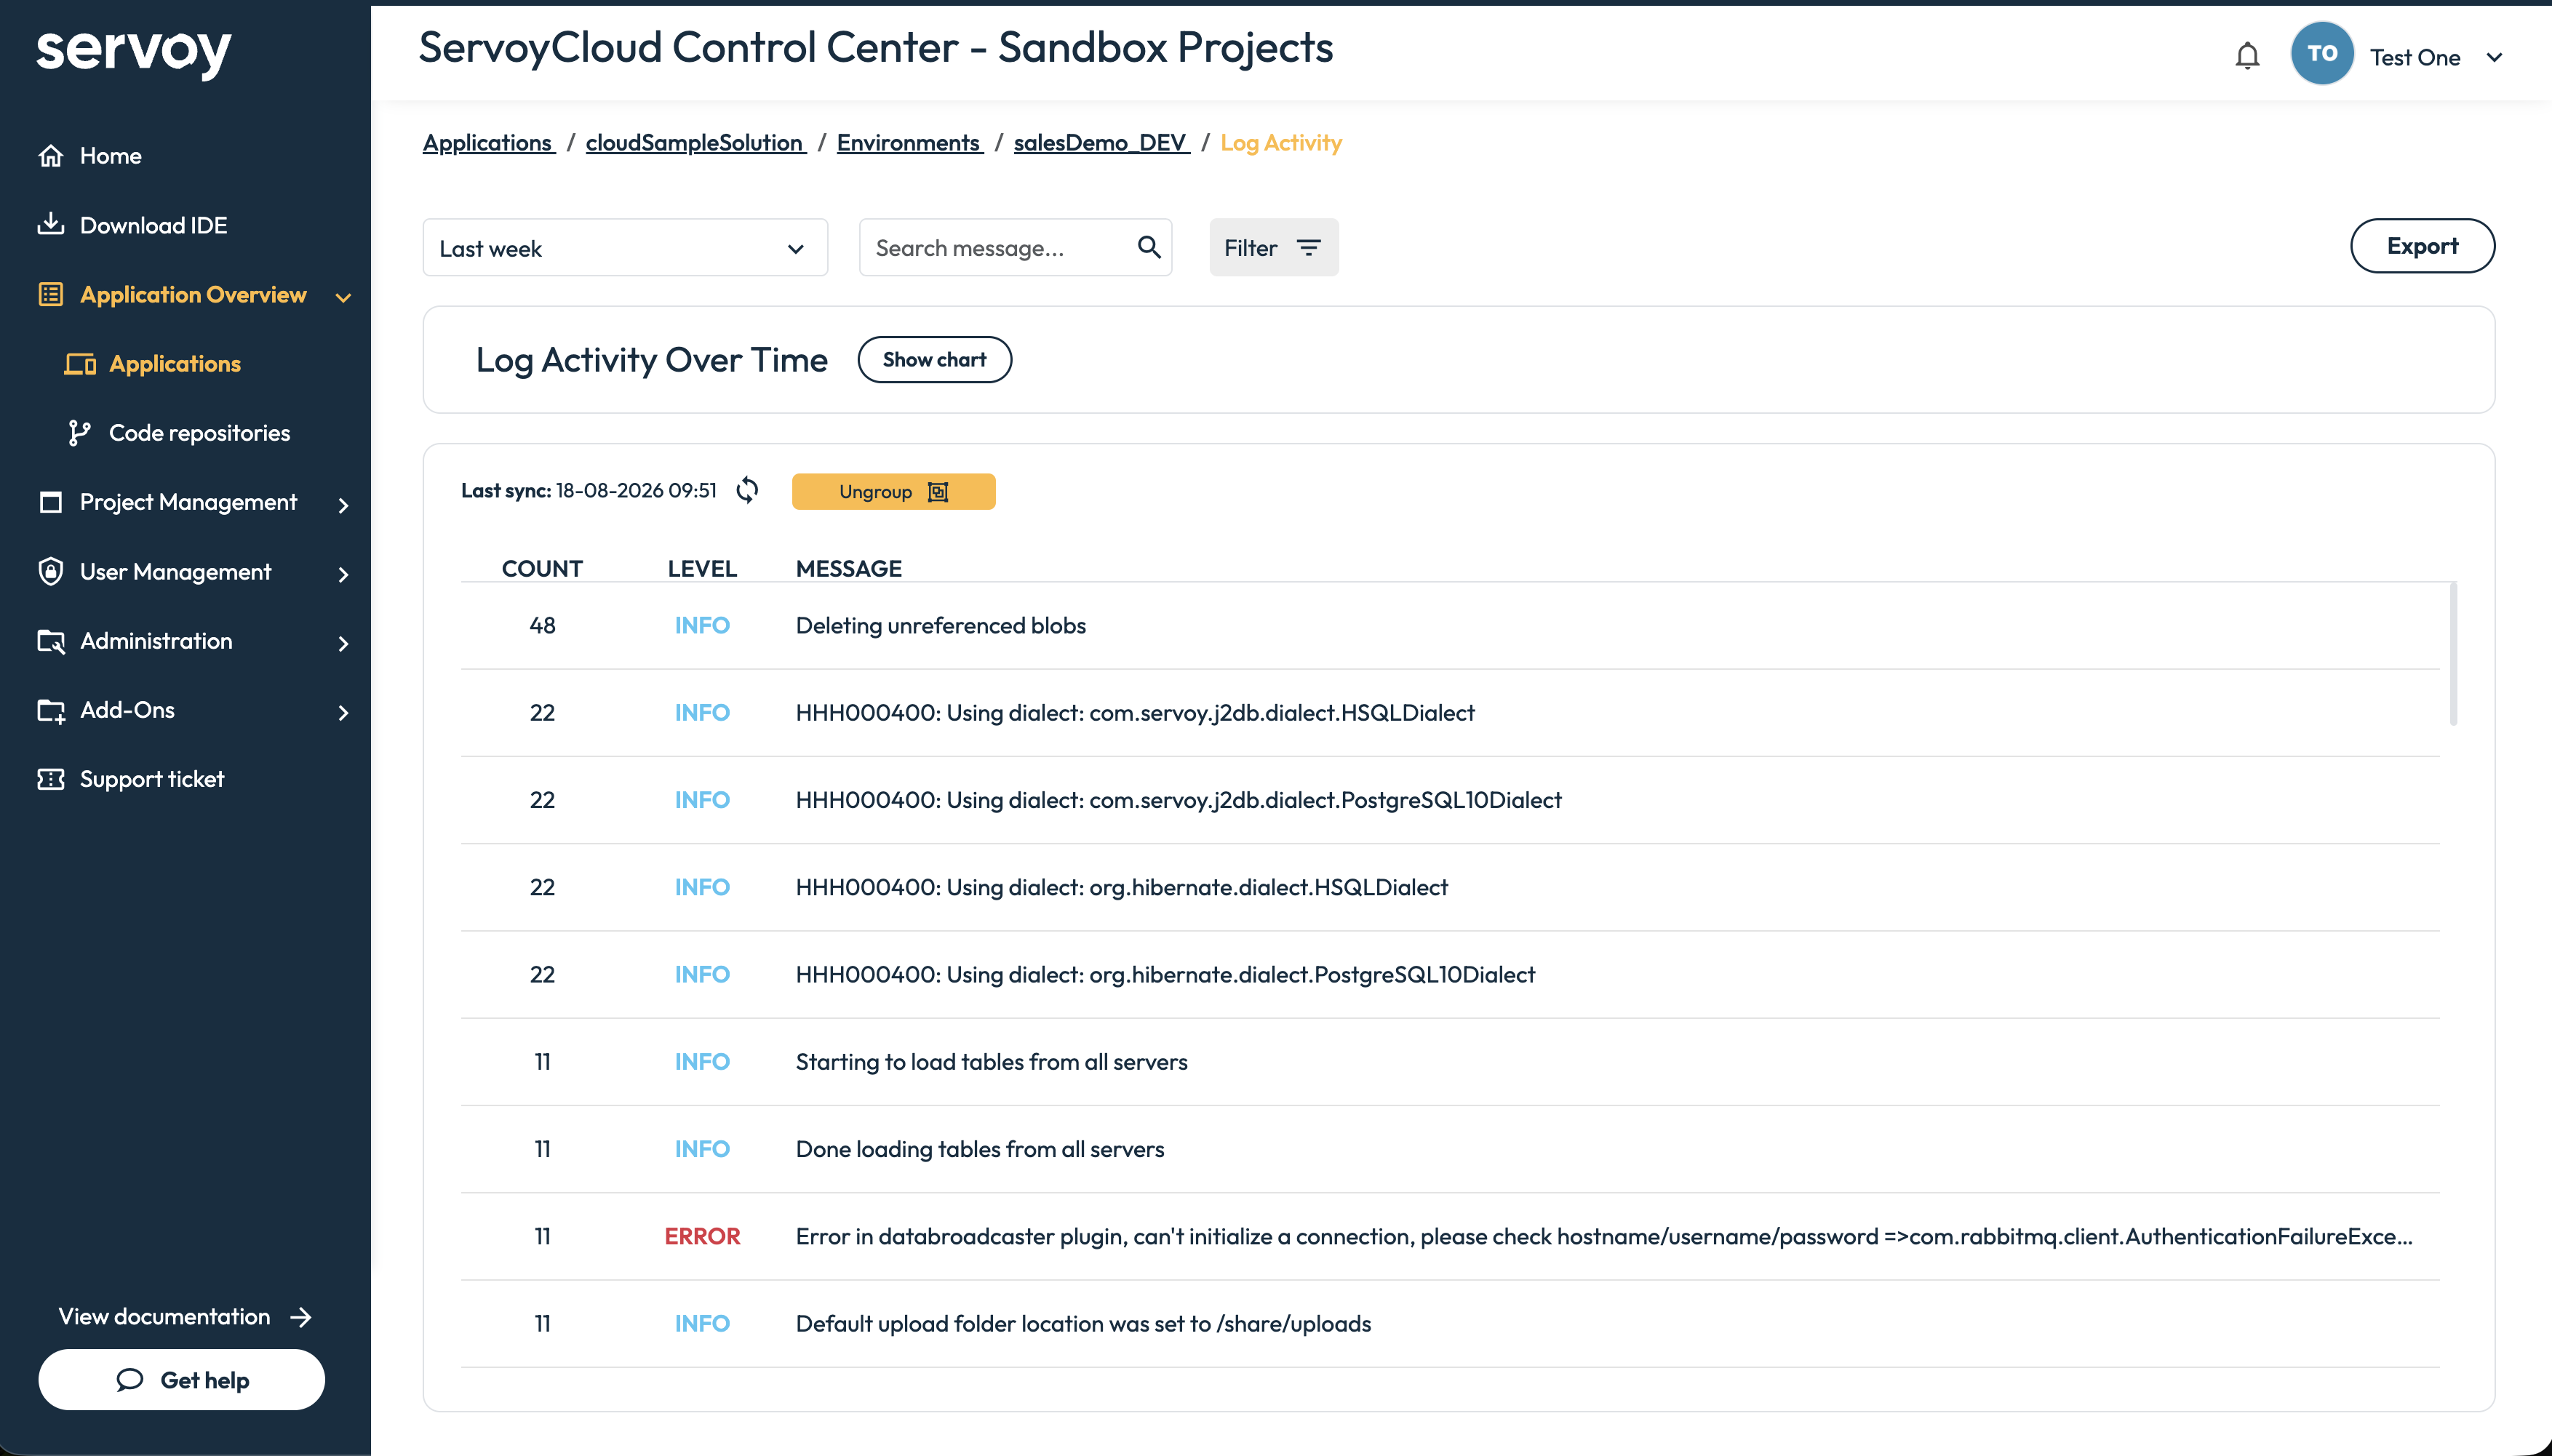
The Log Activity dashboard provides a visual representation of log activity within your environment. It includes charts and a detailed table view.

## Metrics

When analyzing the log activity in the table or chart view, consider the following log levels, which are color coded for better visibility:

* Info (Blue)
* Warning (Yellow)
* Error (Red)
* Fatal (Black)

## Log Analyzer Dialog

To view detailed log activity:

1. Navigate to Application Environments (see navigation flow examples below)
   1. Applications -> Your Application -> Environments -> Click Environment tile
   2. Home -> Environments at-a-glance -> Click Environment tile
2. Click on the Log Activity tile
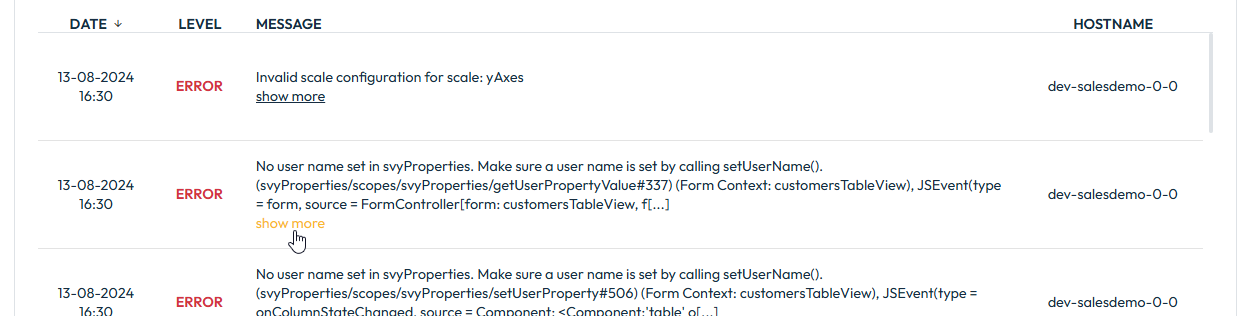
3. Click on the "show more" button of the log entry you want to analyze

<figure><img src="/files/2JHWIXTxPFkkdeTOBLOl" alt=""><figcaption><p>Example of log entry describing where to access the log analyzer</p></figcaption></figure>

### Log details

When you view the log details, you will see:

* Log type
* Log date and time
* Short log message
* Code Snippet with highlighted location in code or stack trace
  * If file and location available in the log and the repository is accessible, the dialog will display a highlighted code block and the Location (the file path and line in code)
  * If code highlighting is not available, the stack trace will be displayed

#### Log Analyzer with code highlighting

<figure><img src="/files/0TkDEFsbPaSgL3JIX3nt" alt=""><figcaption><p>Log Analyzer Dialog with code highlighting and Location</p></figcaption></figure>

#### Log Analyzer without code highlighting

<figure><img src="/files/vBagvCFSuH2383KQ52JJ" alt=""><figcaption><p>Log Analyzer Dialog without code highlighting</p></figcaption></figure>

Additionally, using the other buttons in the dialog, you can do the following:

* Toggle log stack trace
* Show full log message
* Copy the displayed message (either the short or the full message)


---

# Agent Instructions: Querying This Documentation

If you need additional information that is not directly available in this page, you can query the documentation dynamically by asking a question.

Perform an HTTP GET request on the current page URL with the `ask` query parameter:

```
GET https://docs.servoy.com/reference/servoy-cloud/cloud-control-center/application-overview/applications/environments/metrics/log-activity.md?ask=<question>
```

The question should be specific, self-contained, and written in natural language.
The response will contain a direct answer to the question and relevant excerpts and sources from the documentation.

Use this mechanism when the answer is not explicitly present in the current page, you need clarification or additional context, or you want to retrieve related documentation sections.